From Data to Report: How it Works
Step 1 – Dig Deeper into the Data
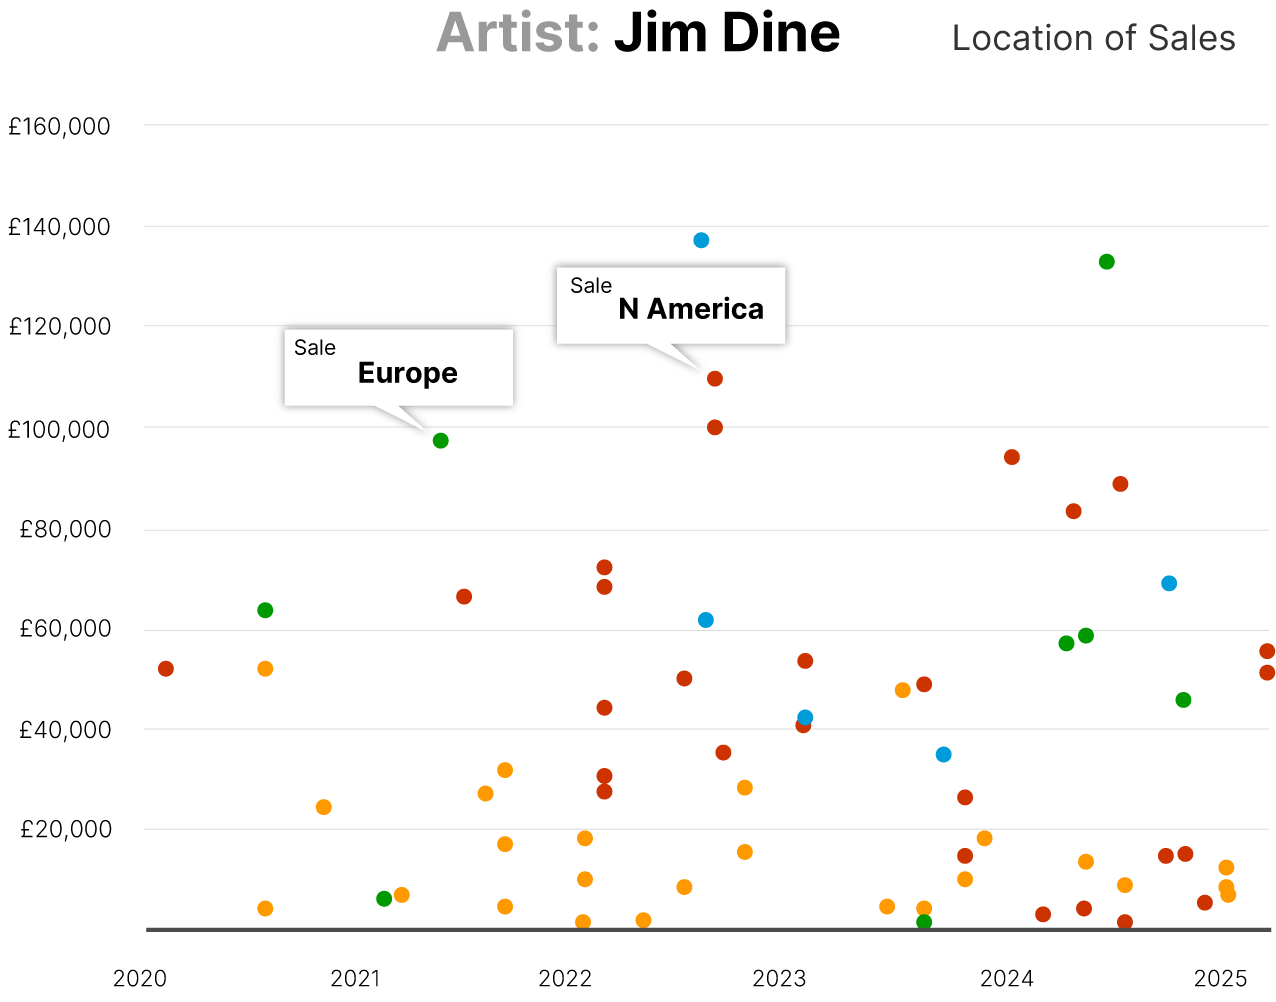
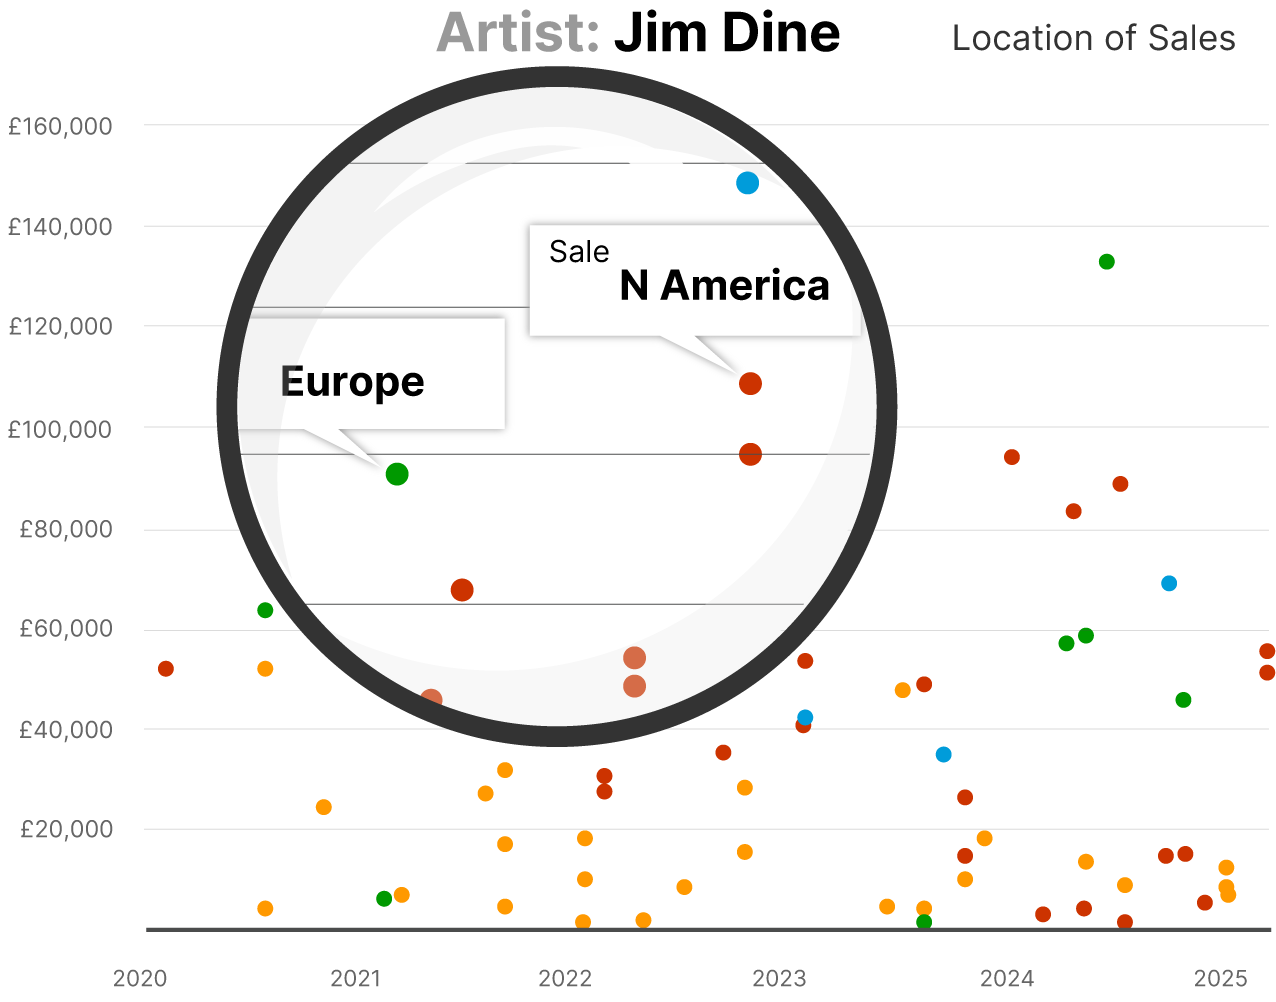
It begins with the raw evidence. Transparent charts show where works are sold, and how collectors and auction houses shape supply and demand.
Step 2 – Sales Activity – weighted by value
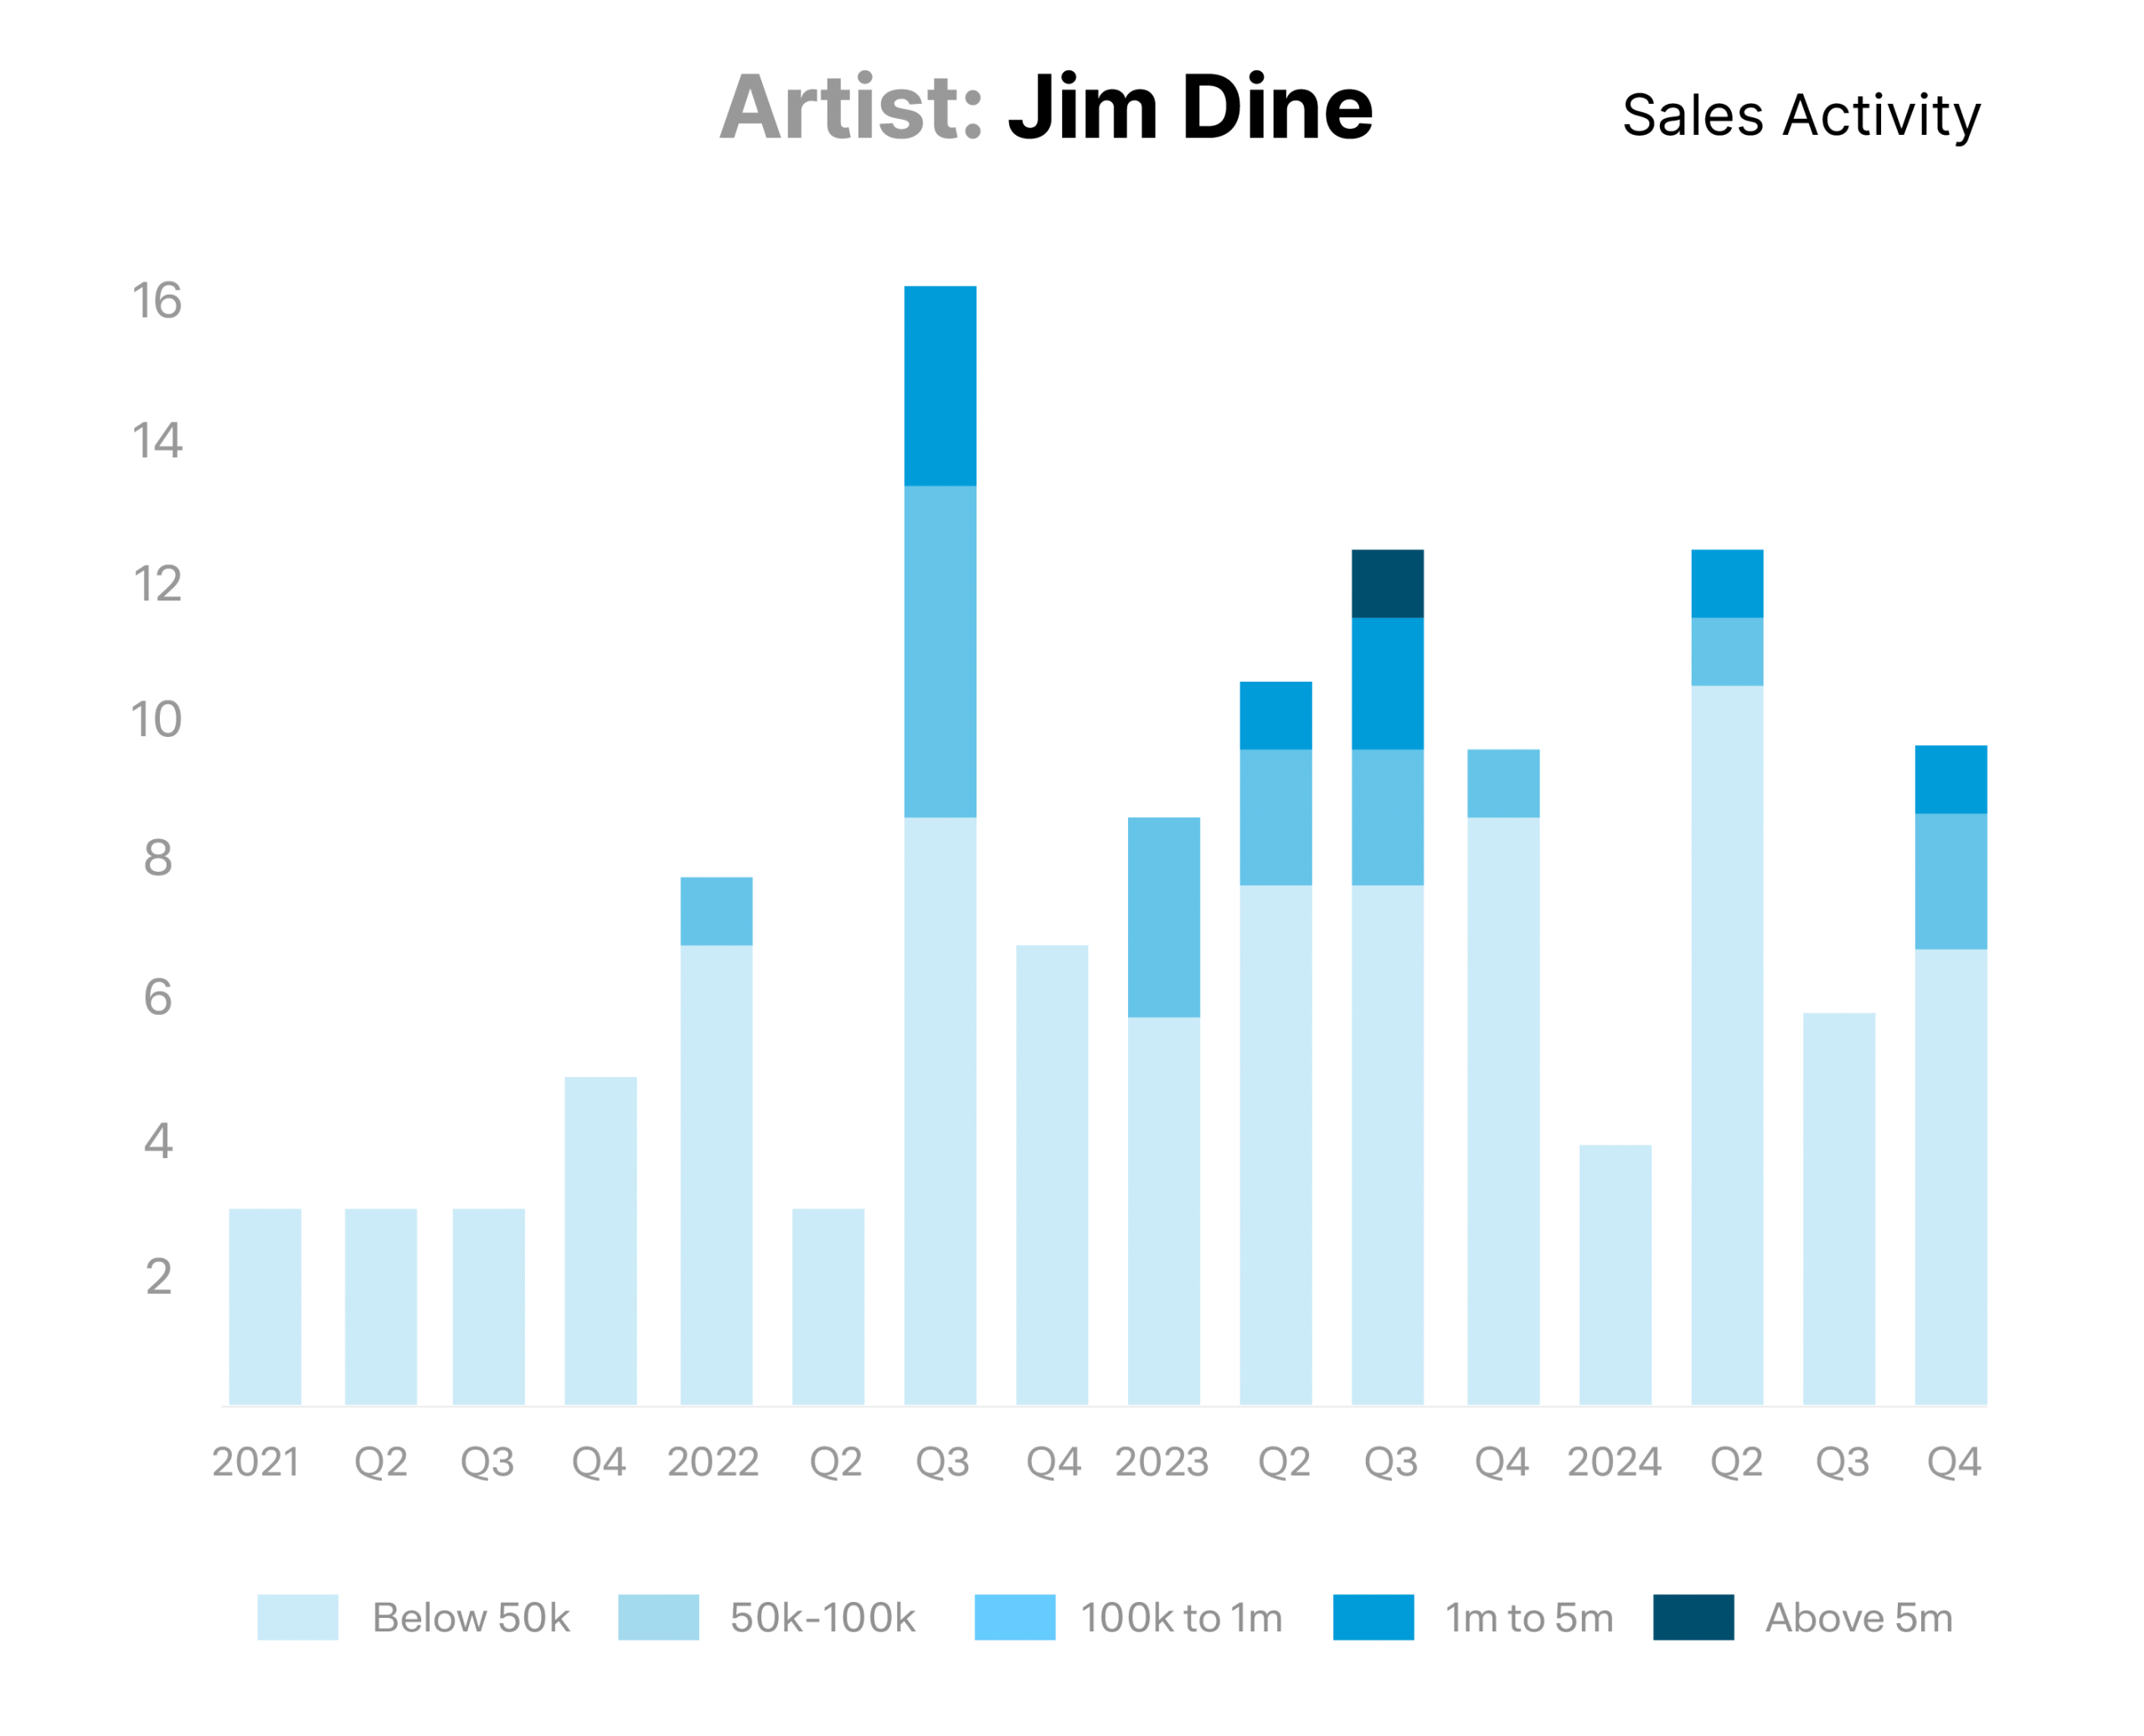
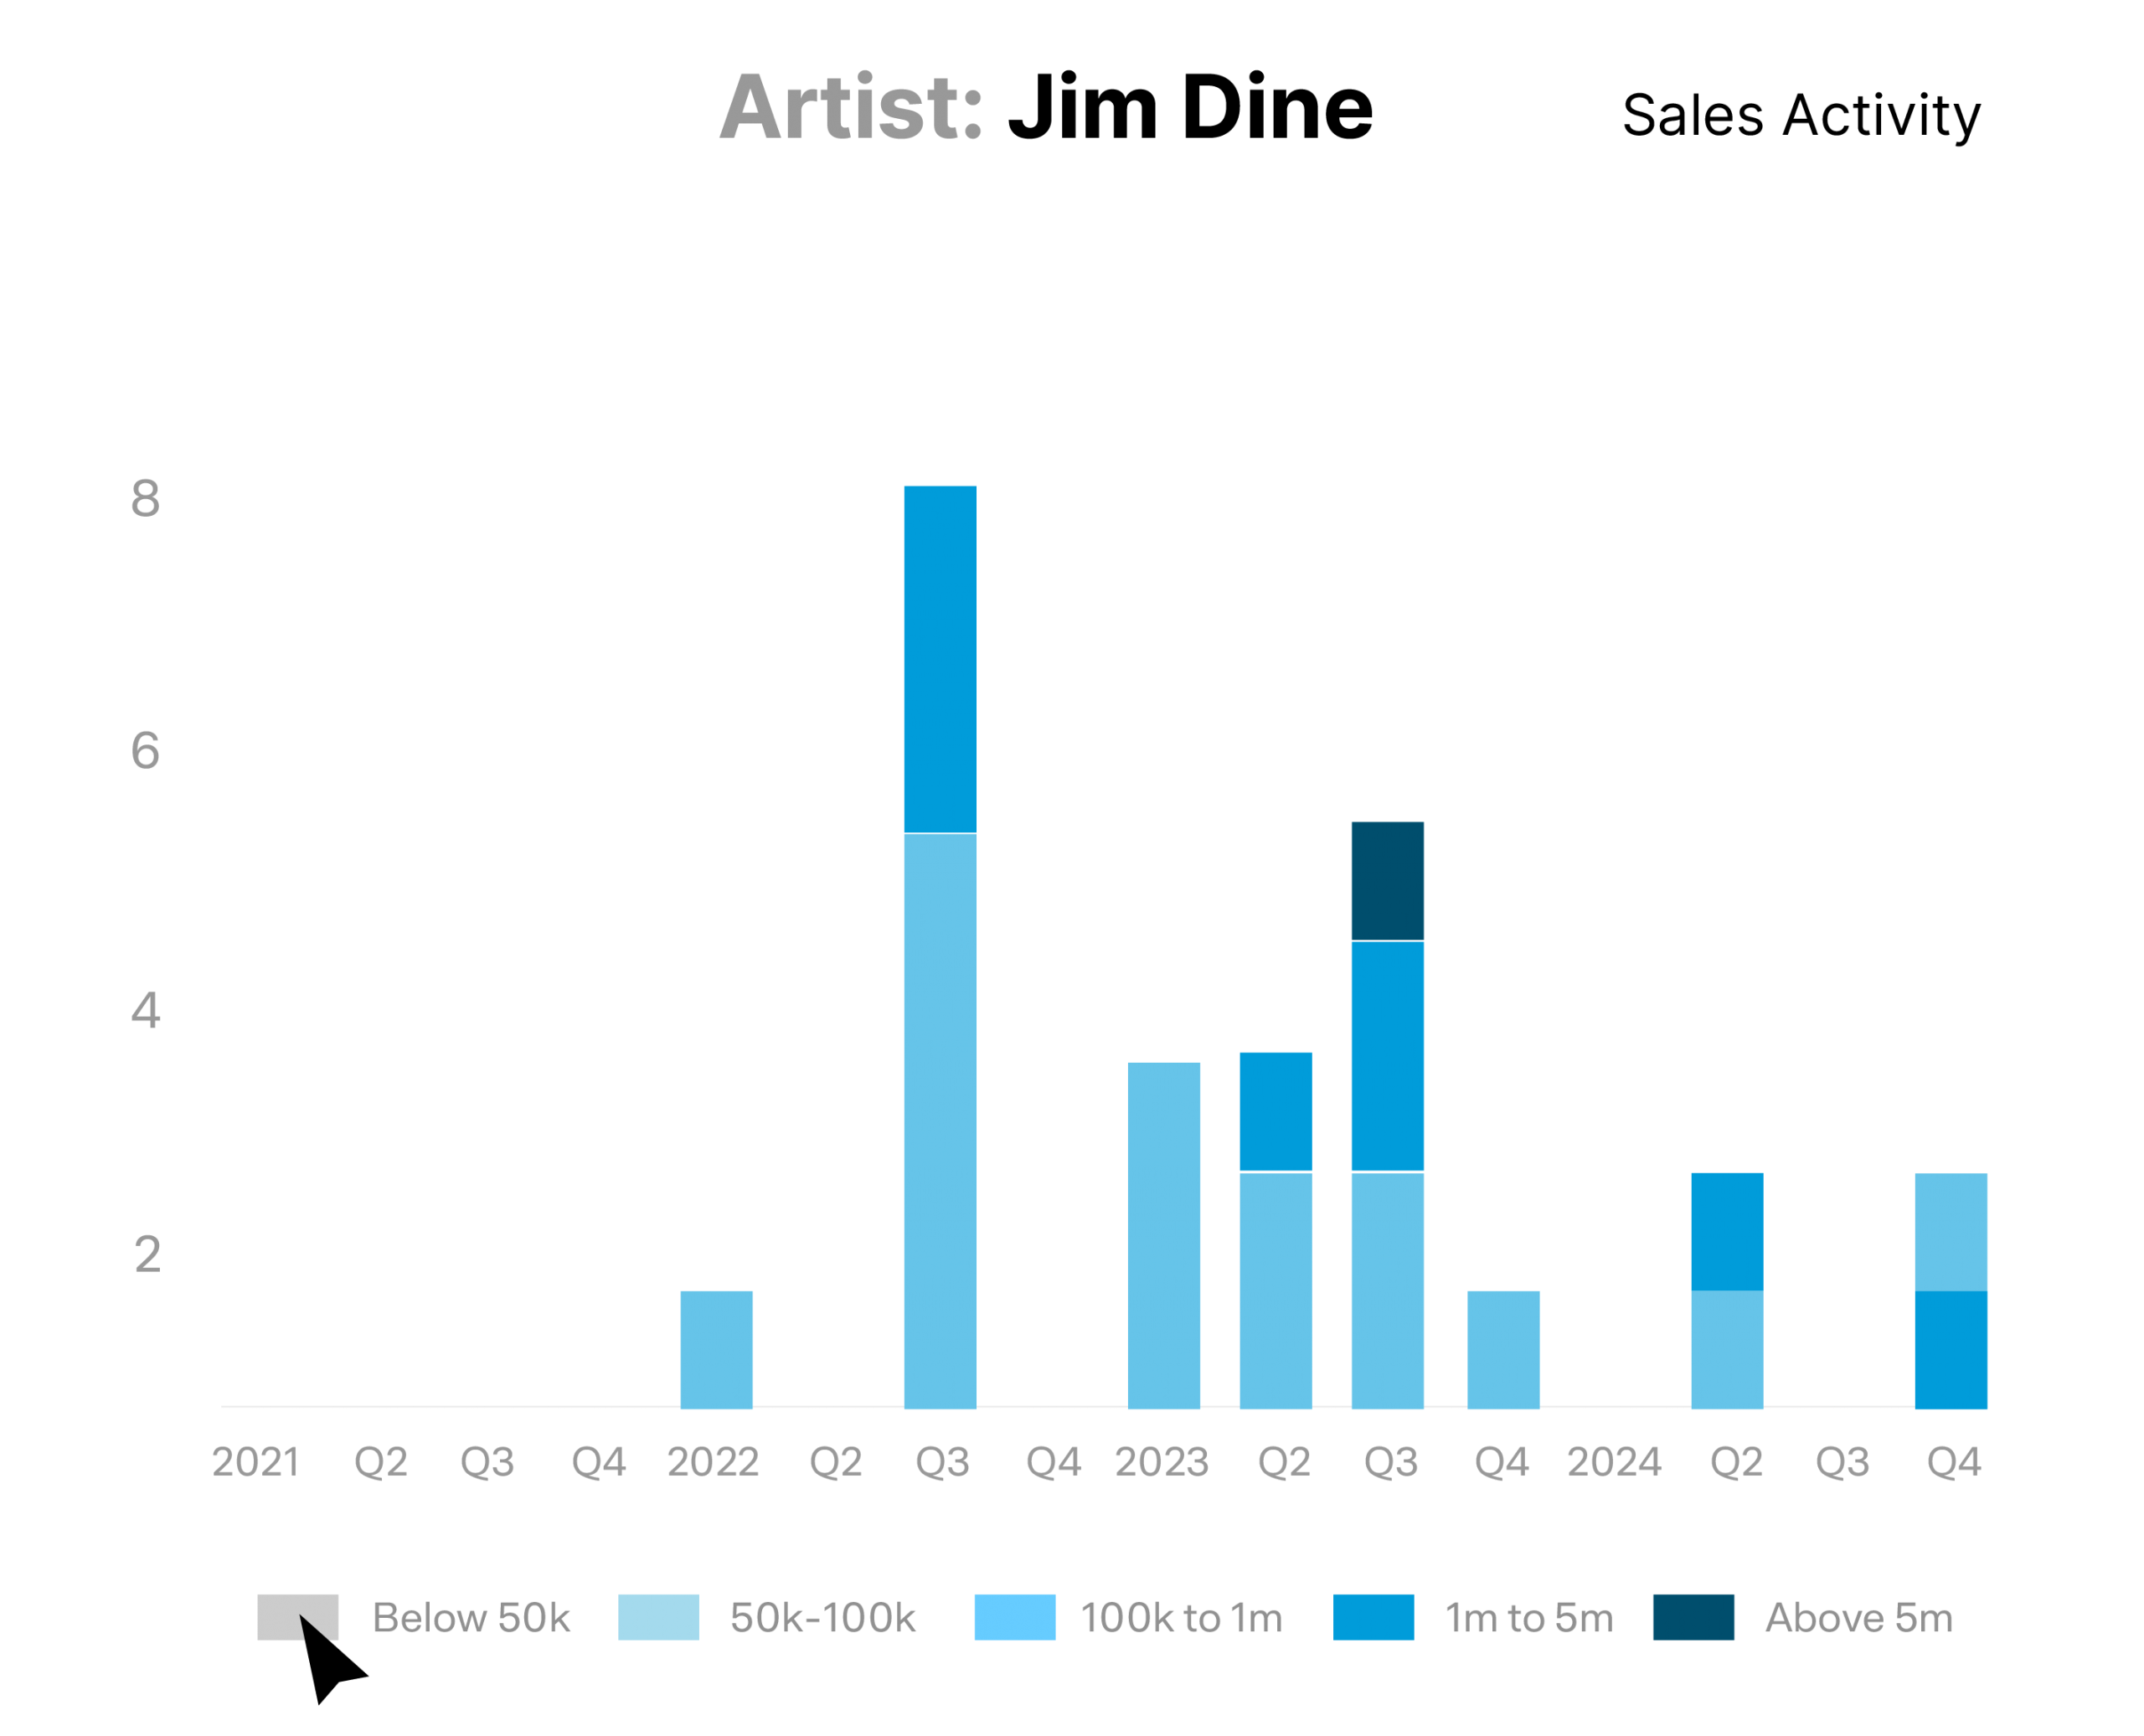
A headline sale can grab attention, but real confidence comes from depth. Our liquidity charts reveal activity across price brackets — showing whether sales are plentiful enough to benchmark, or too thin to rely on.

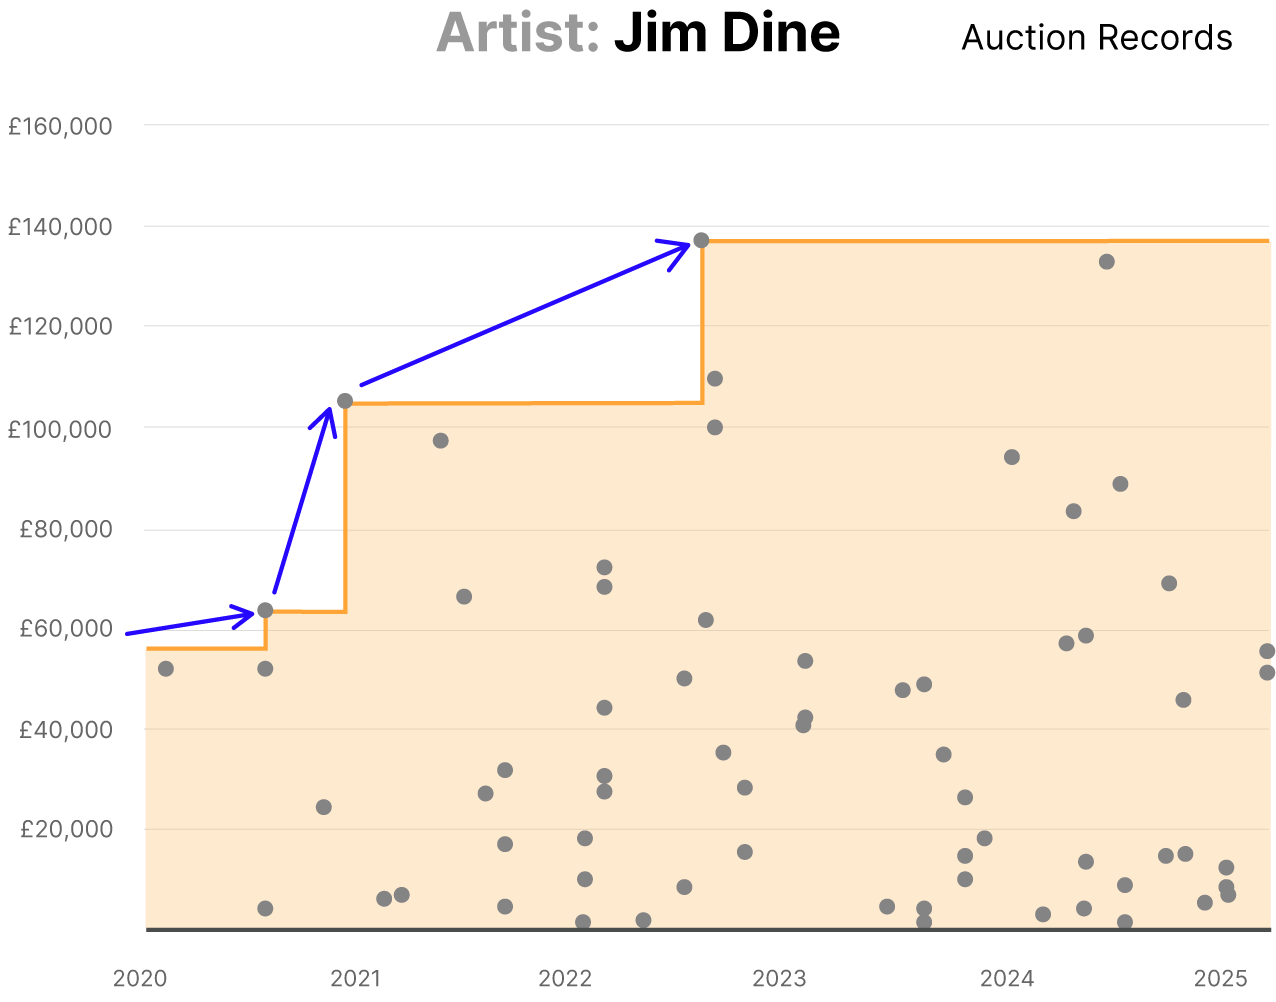
Step 3 – Are prices still climbing?
Momentum matters. Our auction records track new highs as they happen, so you can see whether demand is accelerating — or settling into maturity.
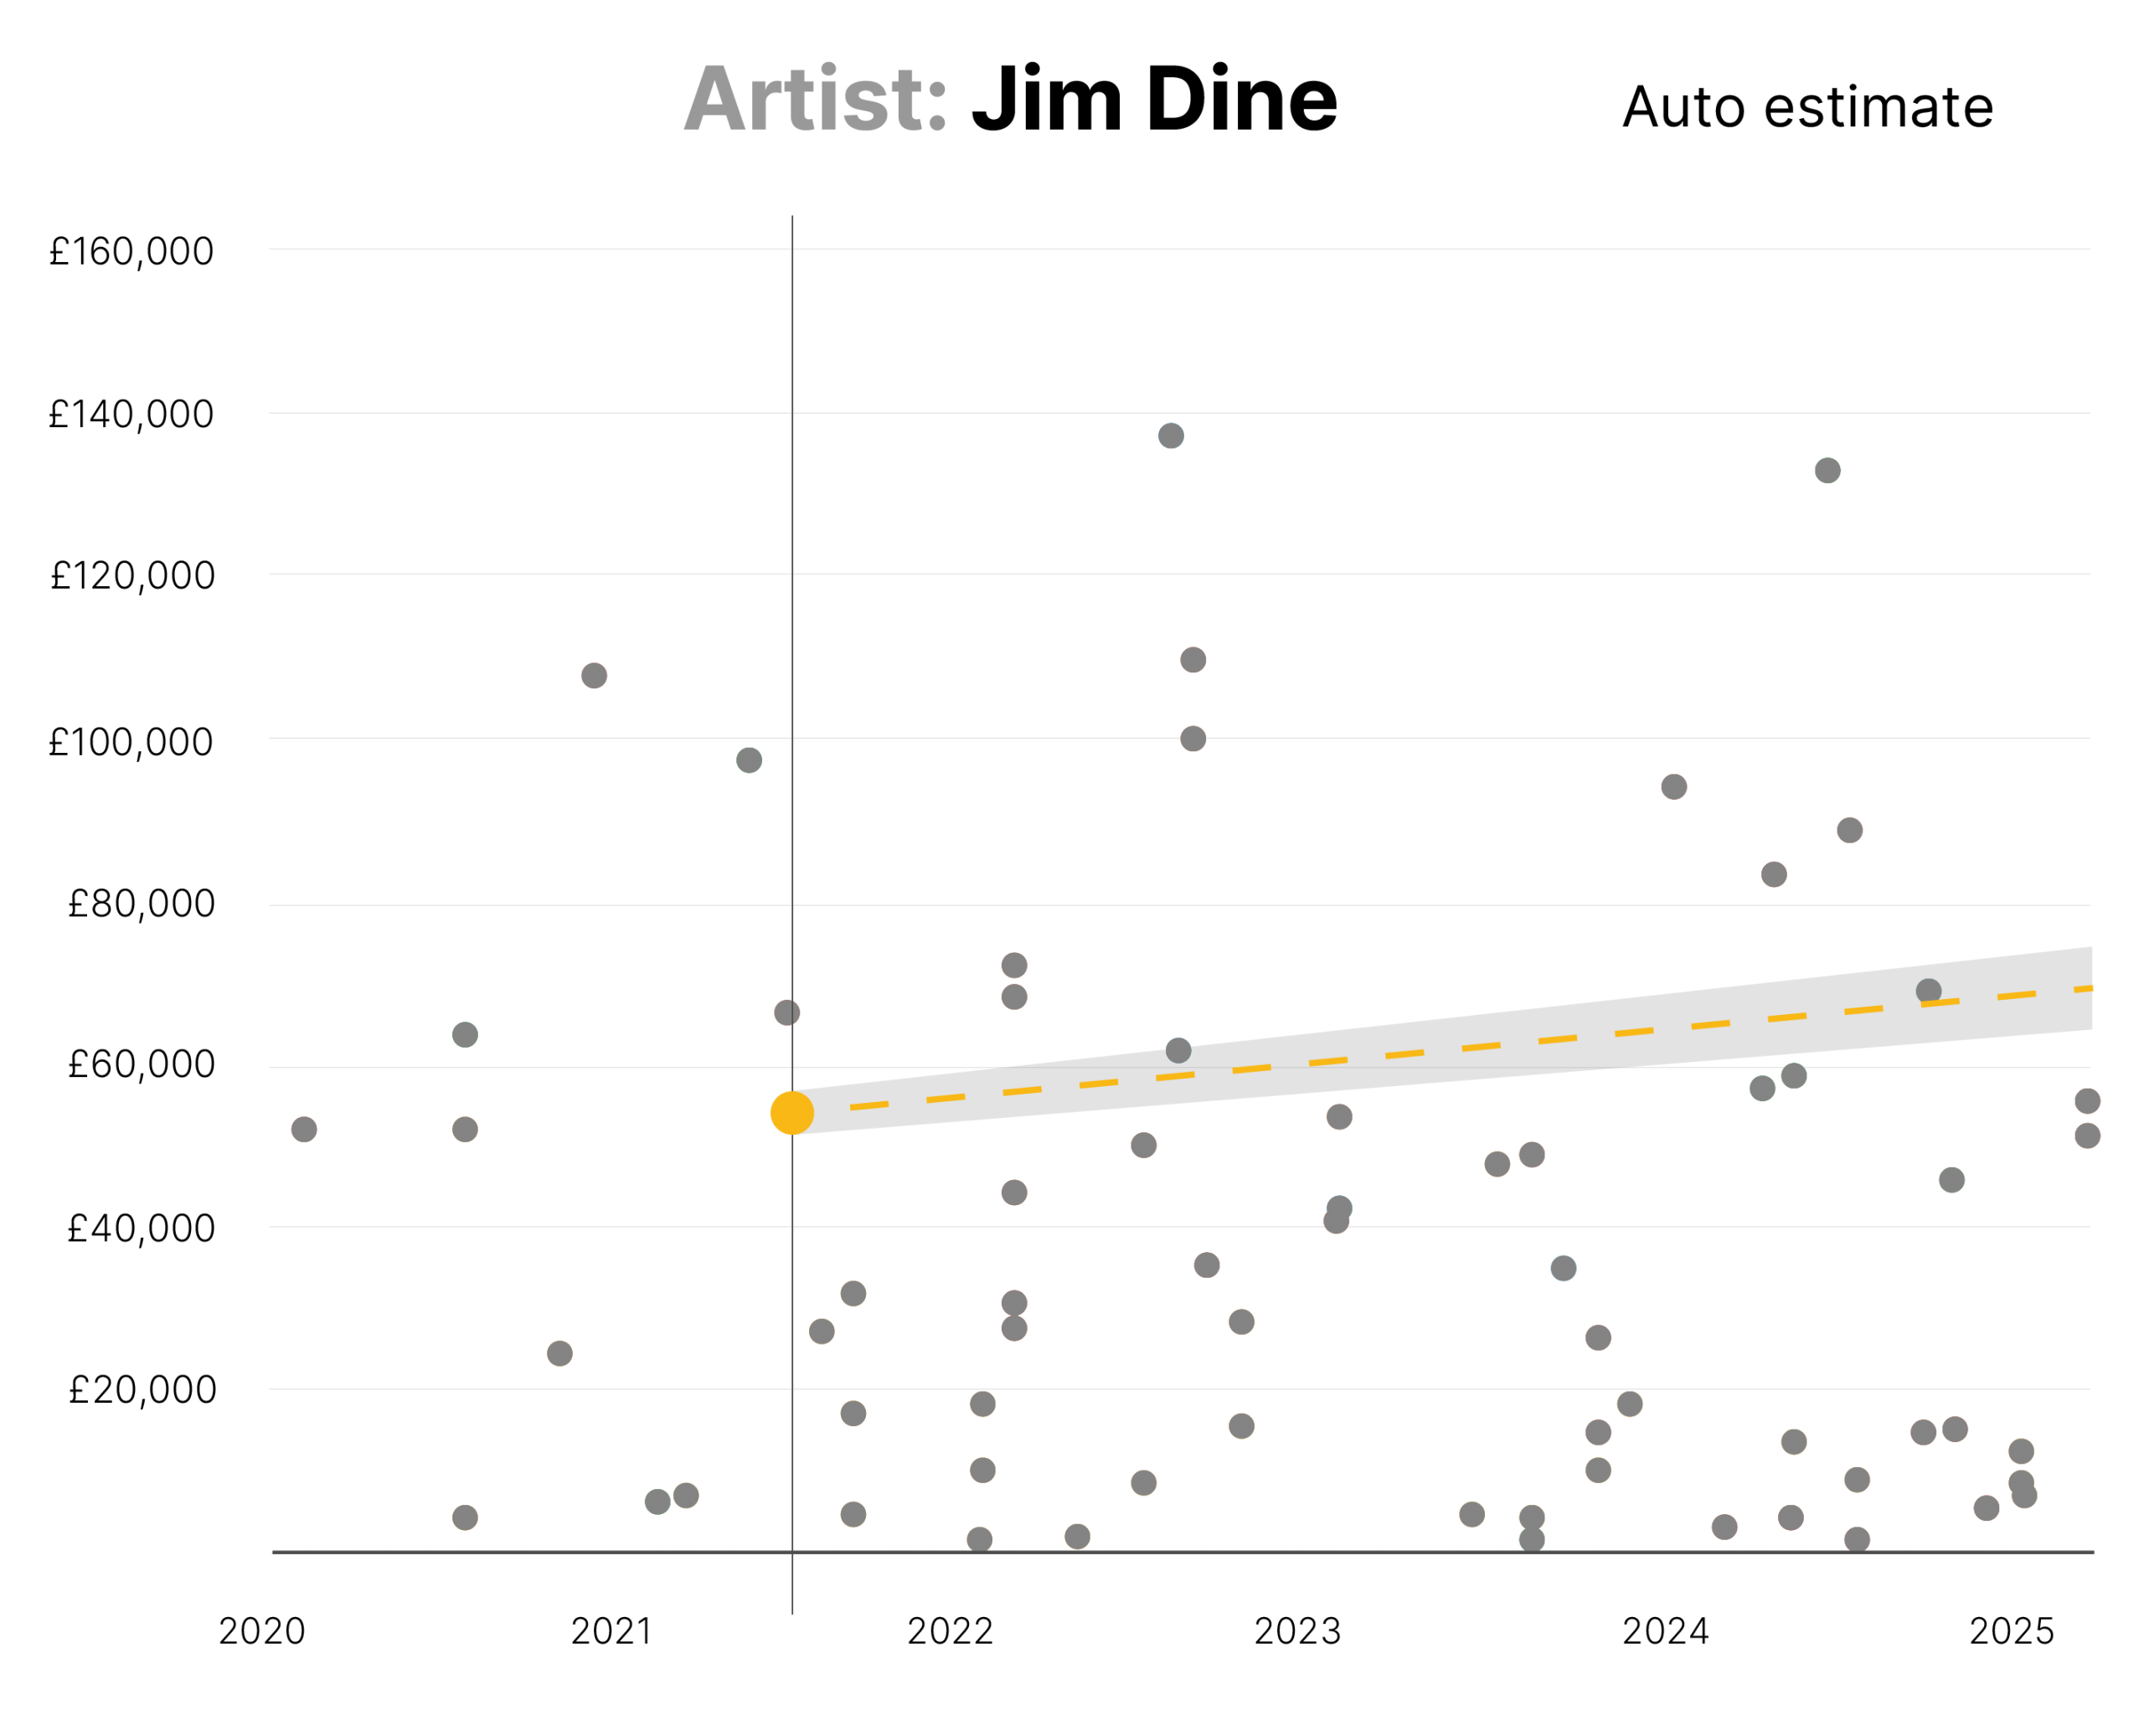
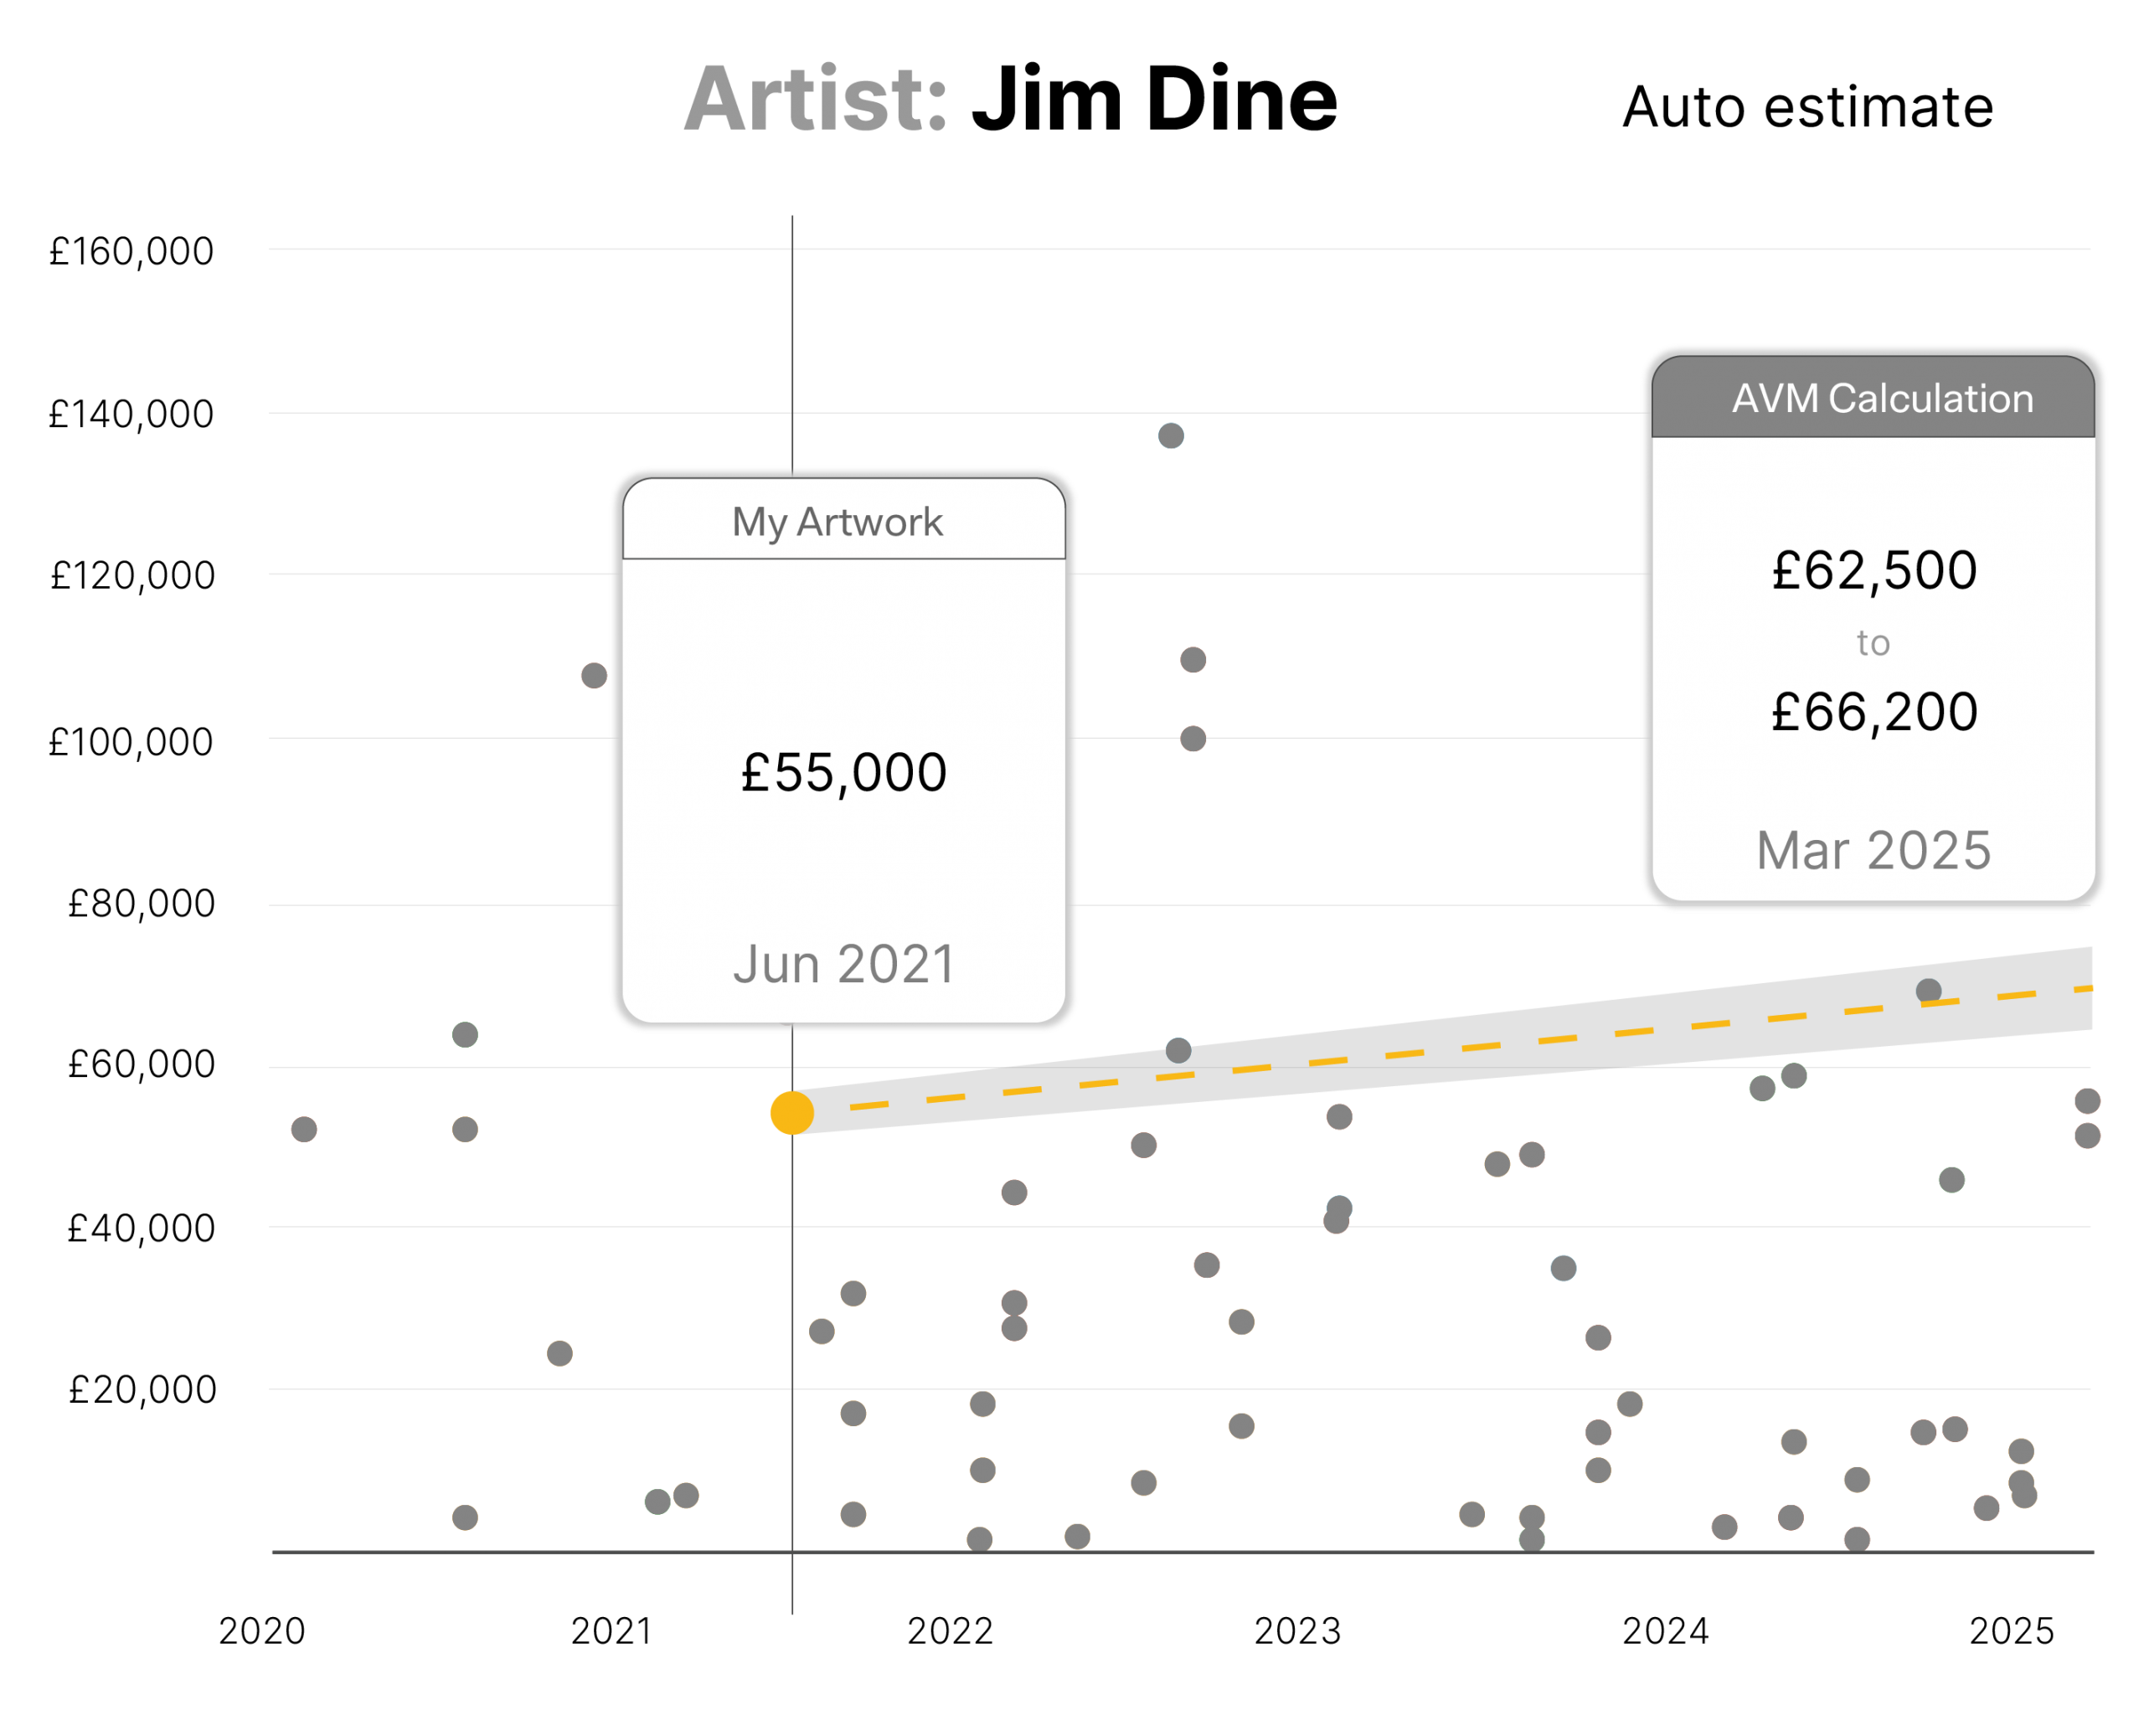
Step 4 – Get an instant valuation
When enough sales data exists, our Automated Valuation Model provides a current market estimate. Where data is thinner, we still map your artwork within the distribution of past results — showing its percentile position in the wider market.
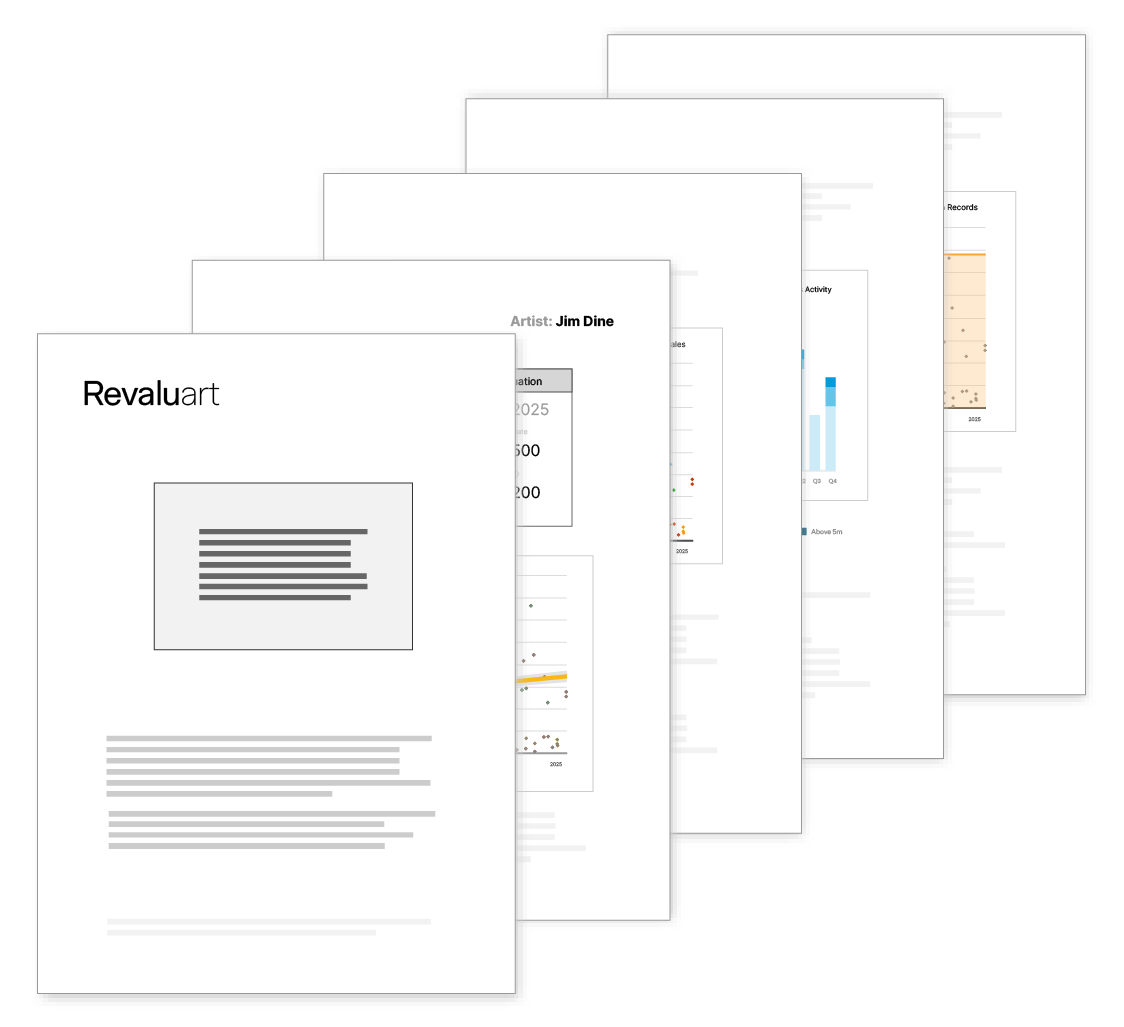
Step 5 – Personalised artist valuation report
All of this comes together in your downloadable report — valuations, charts, and comparables in one place. Designed to guide buying, selling, collecting, or appraising with confidence.
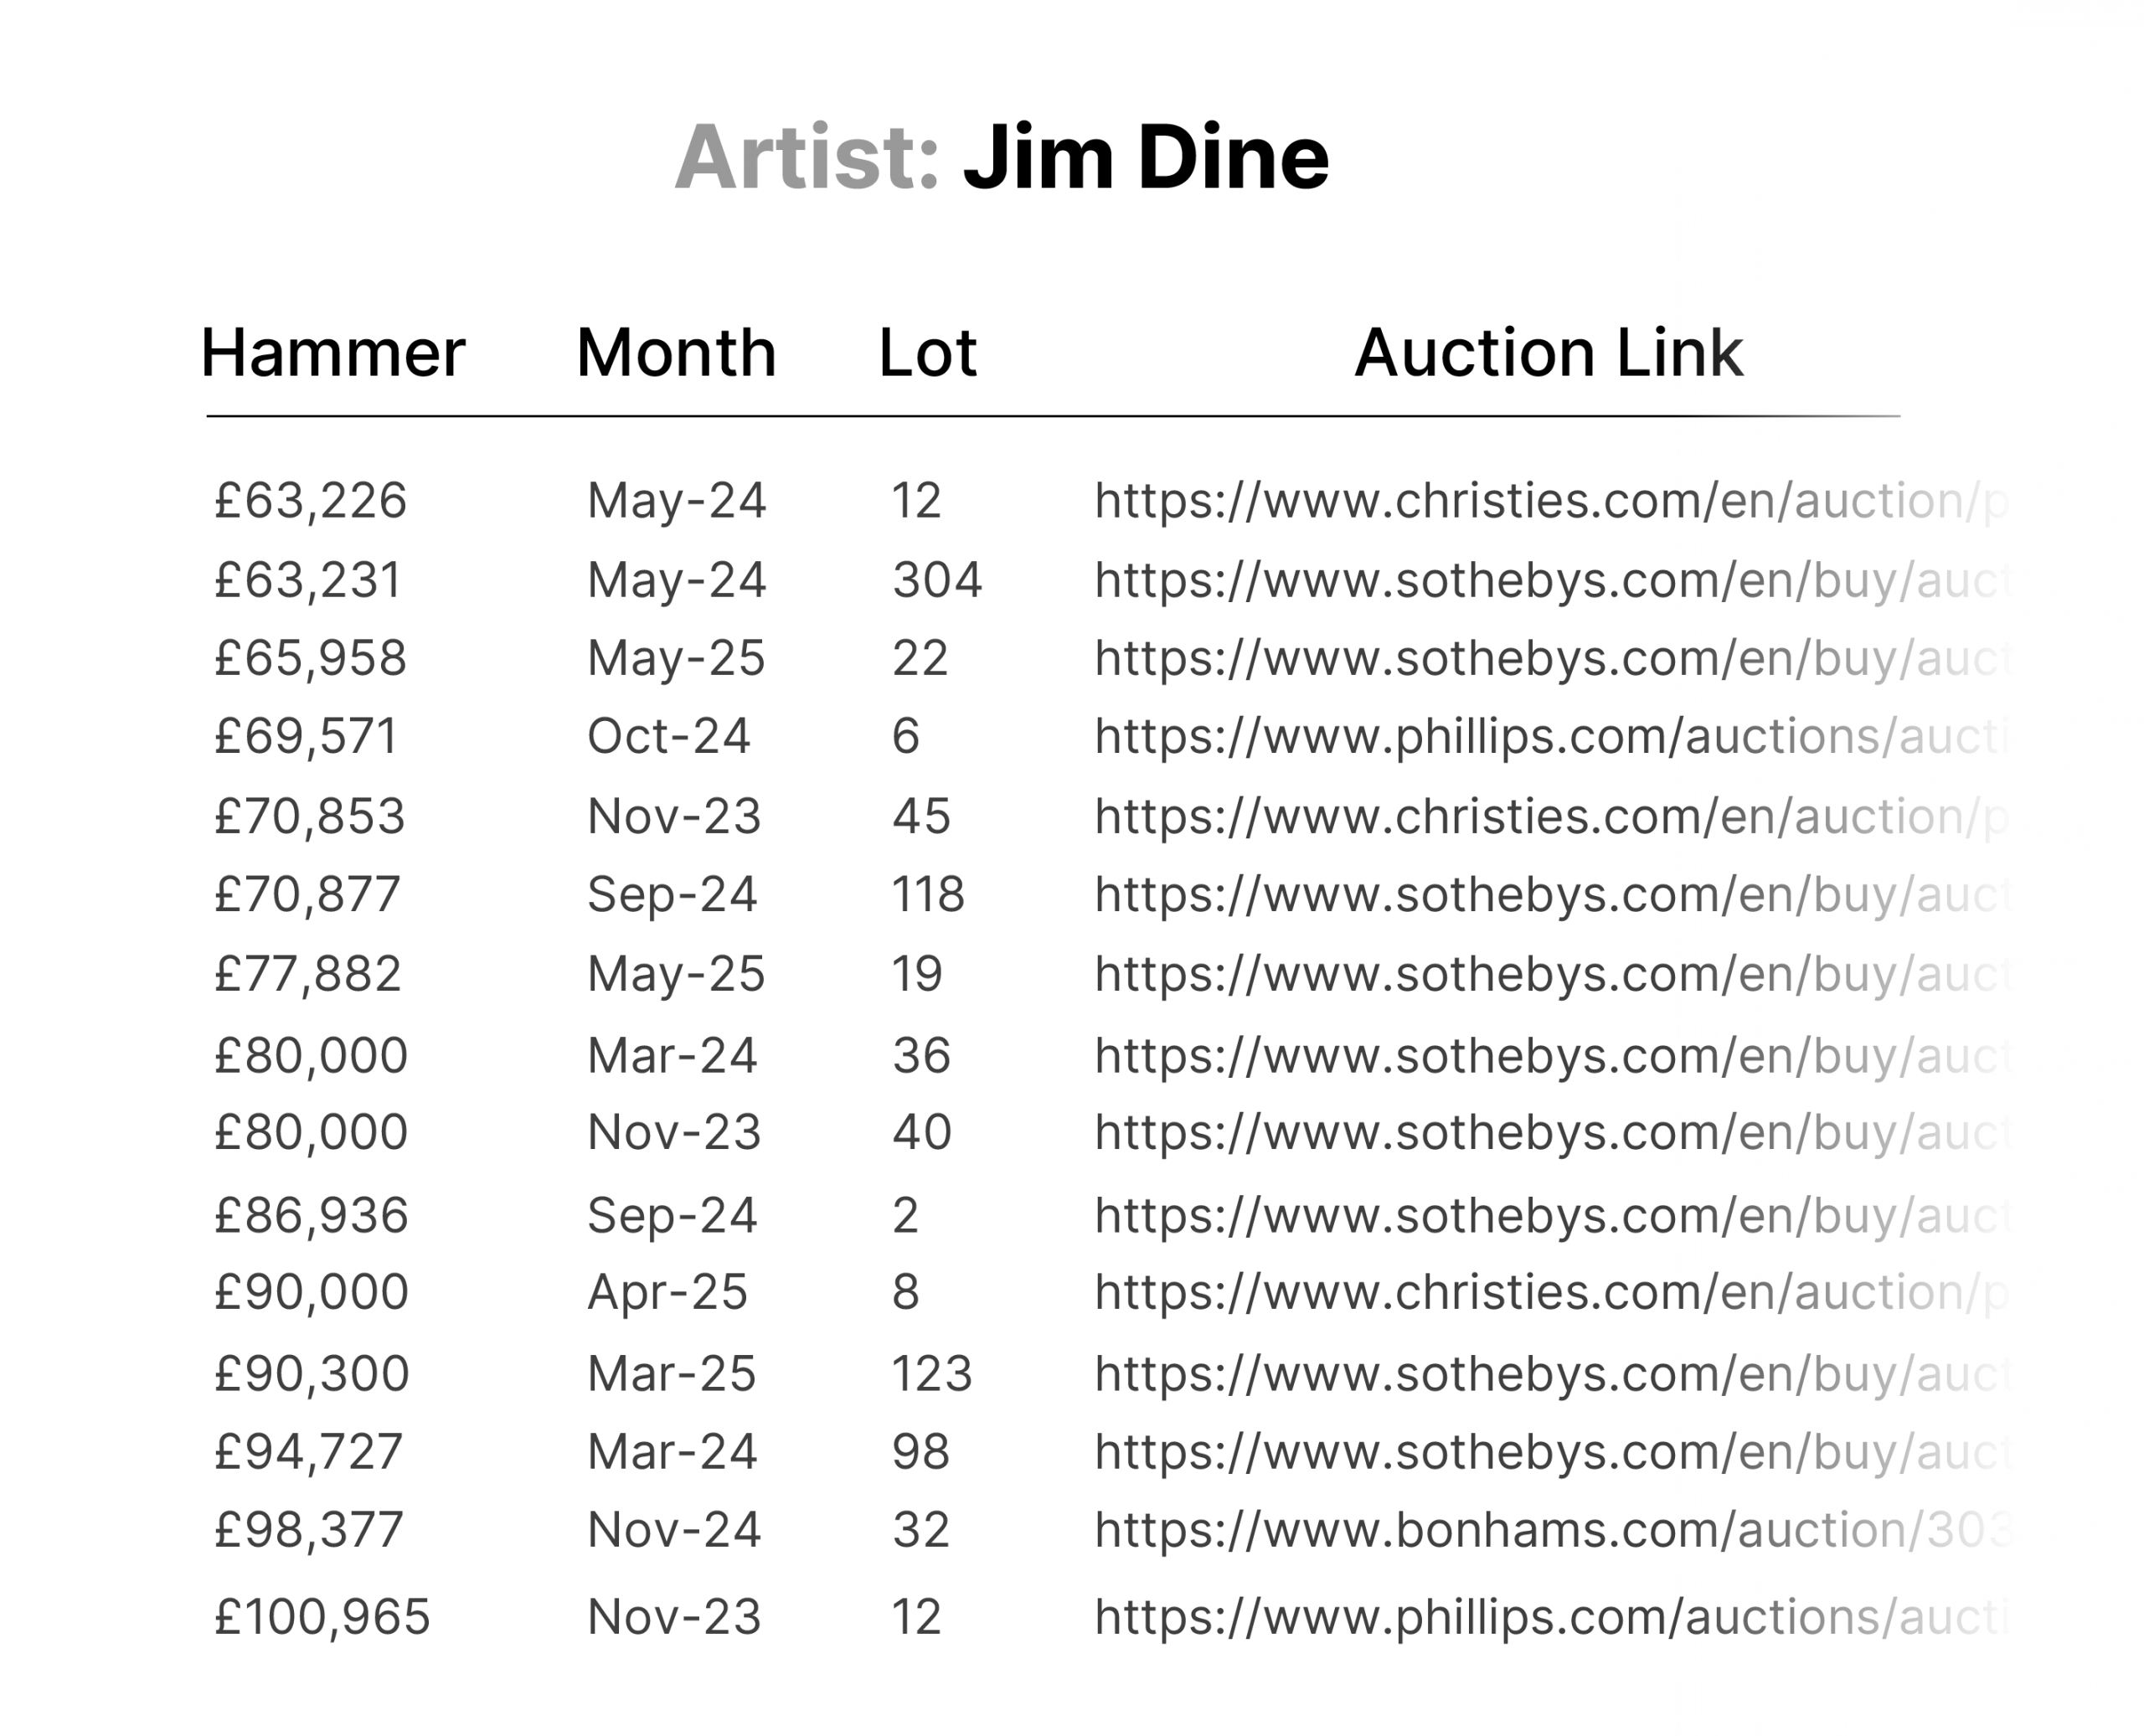
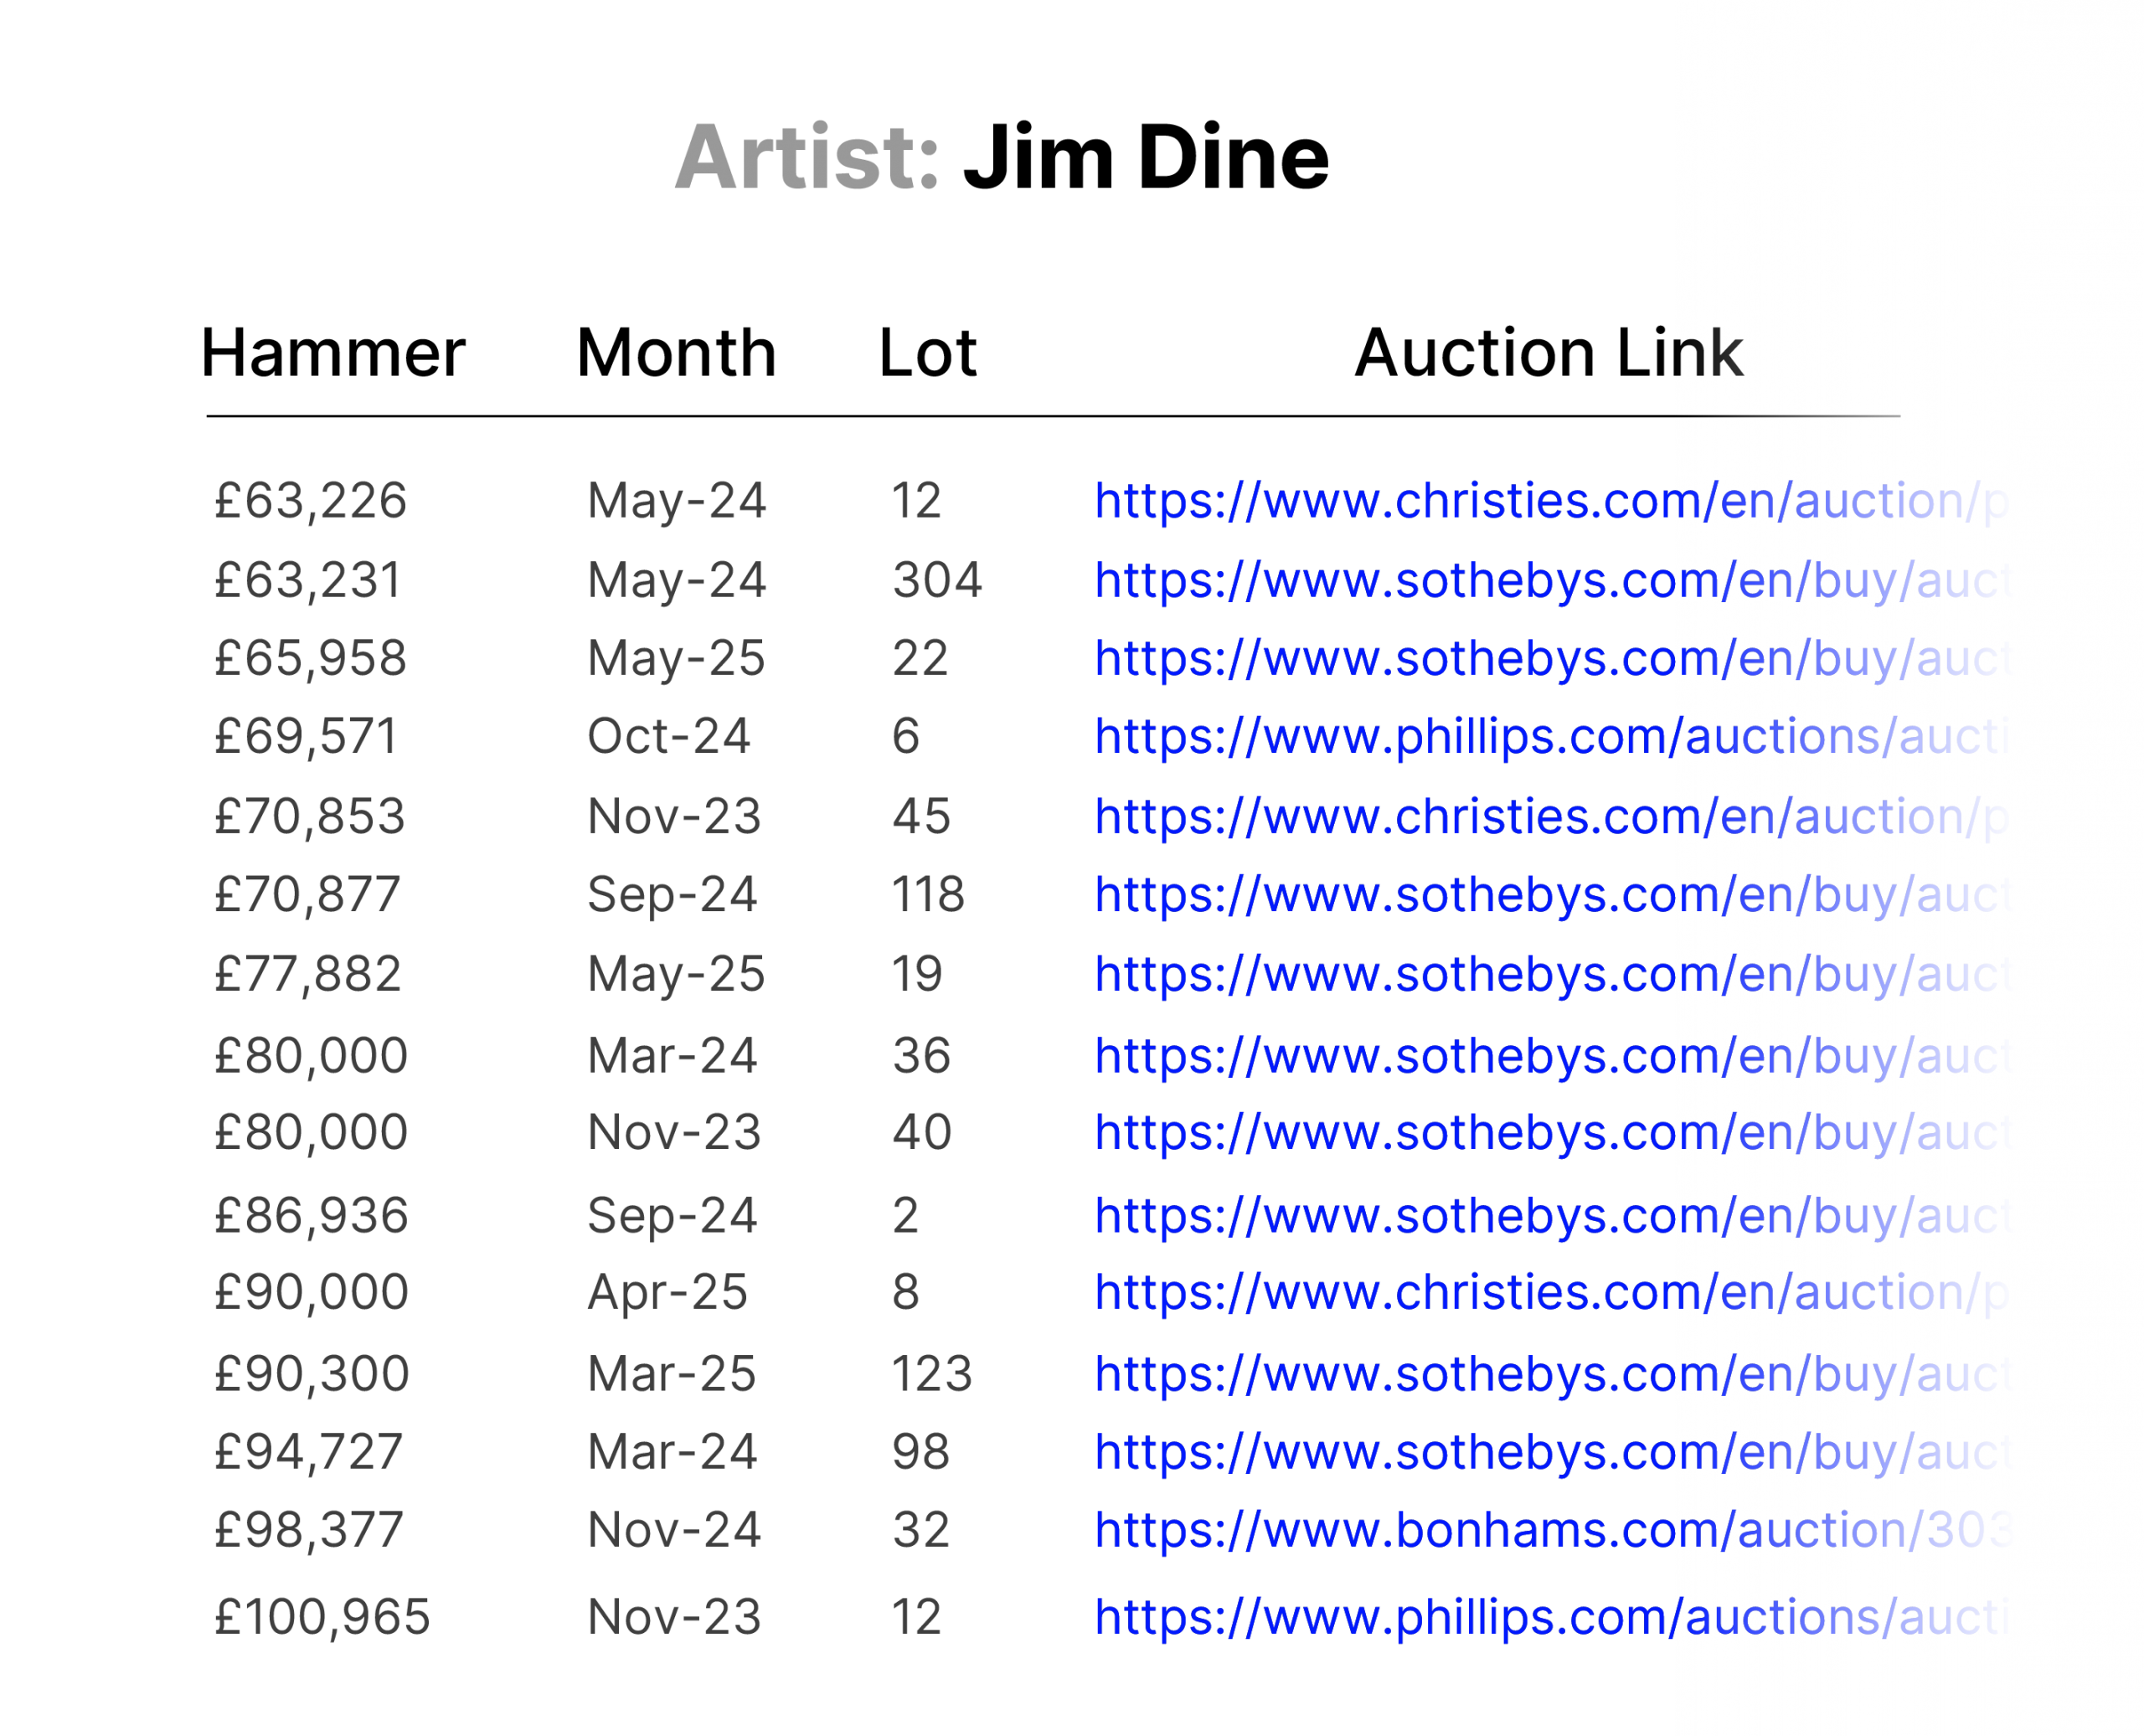
Step 6 – From Report to Source
Within your report, market signals are further supported by hyperlinks to recent auction records for the artist — giving you a quick way to look up the closest comparables, or works aligned by price.
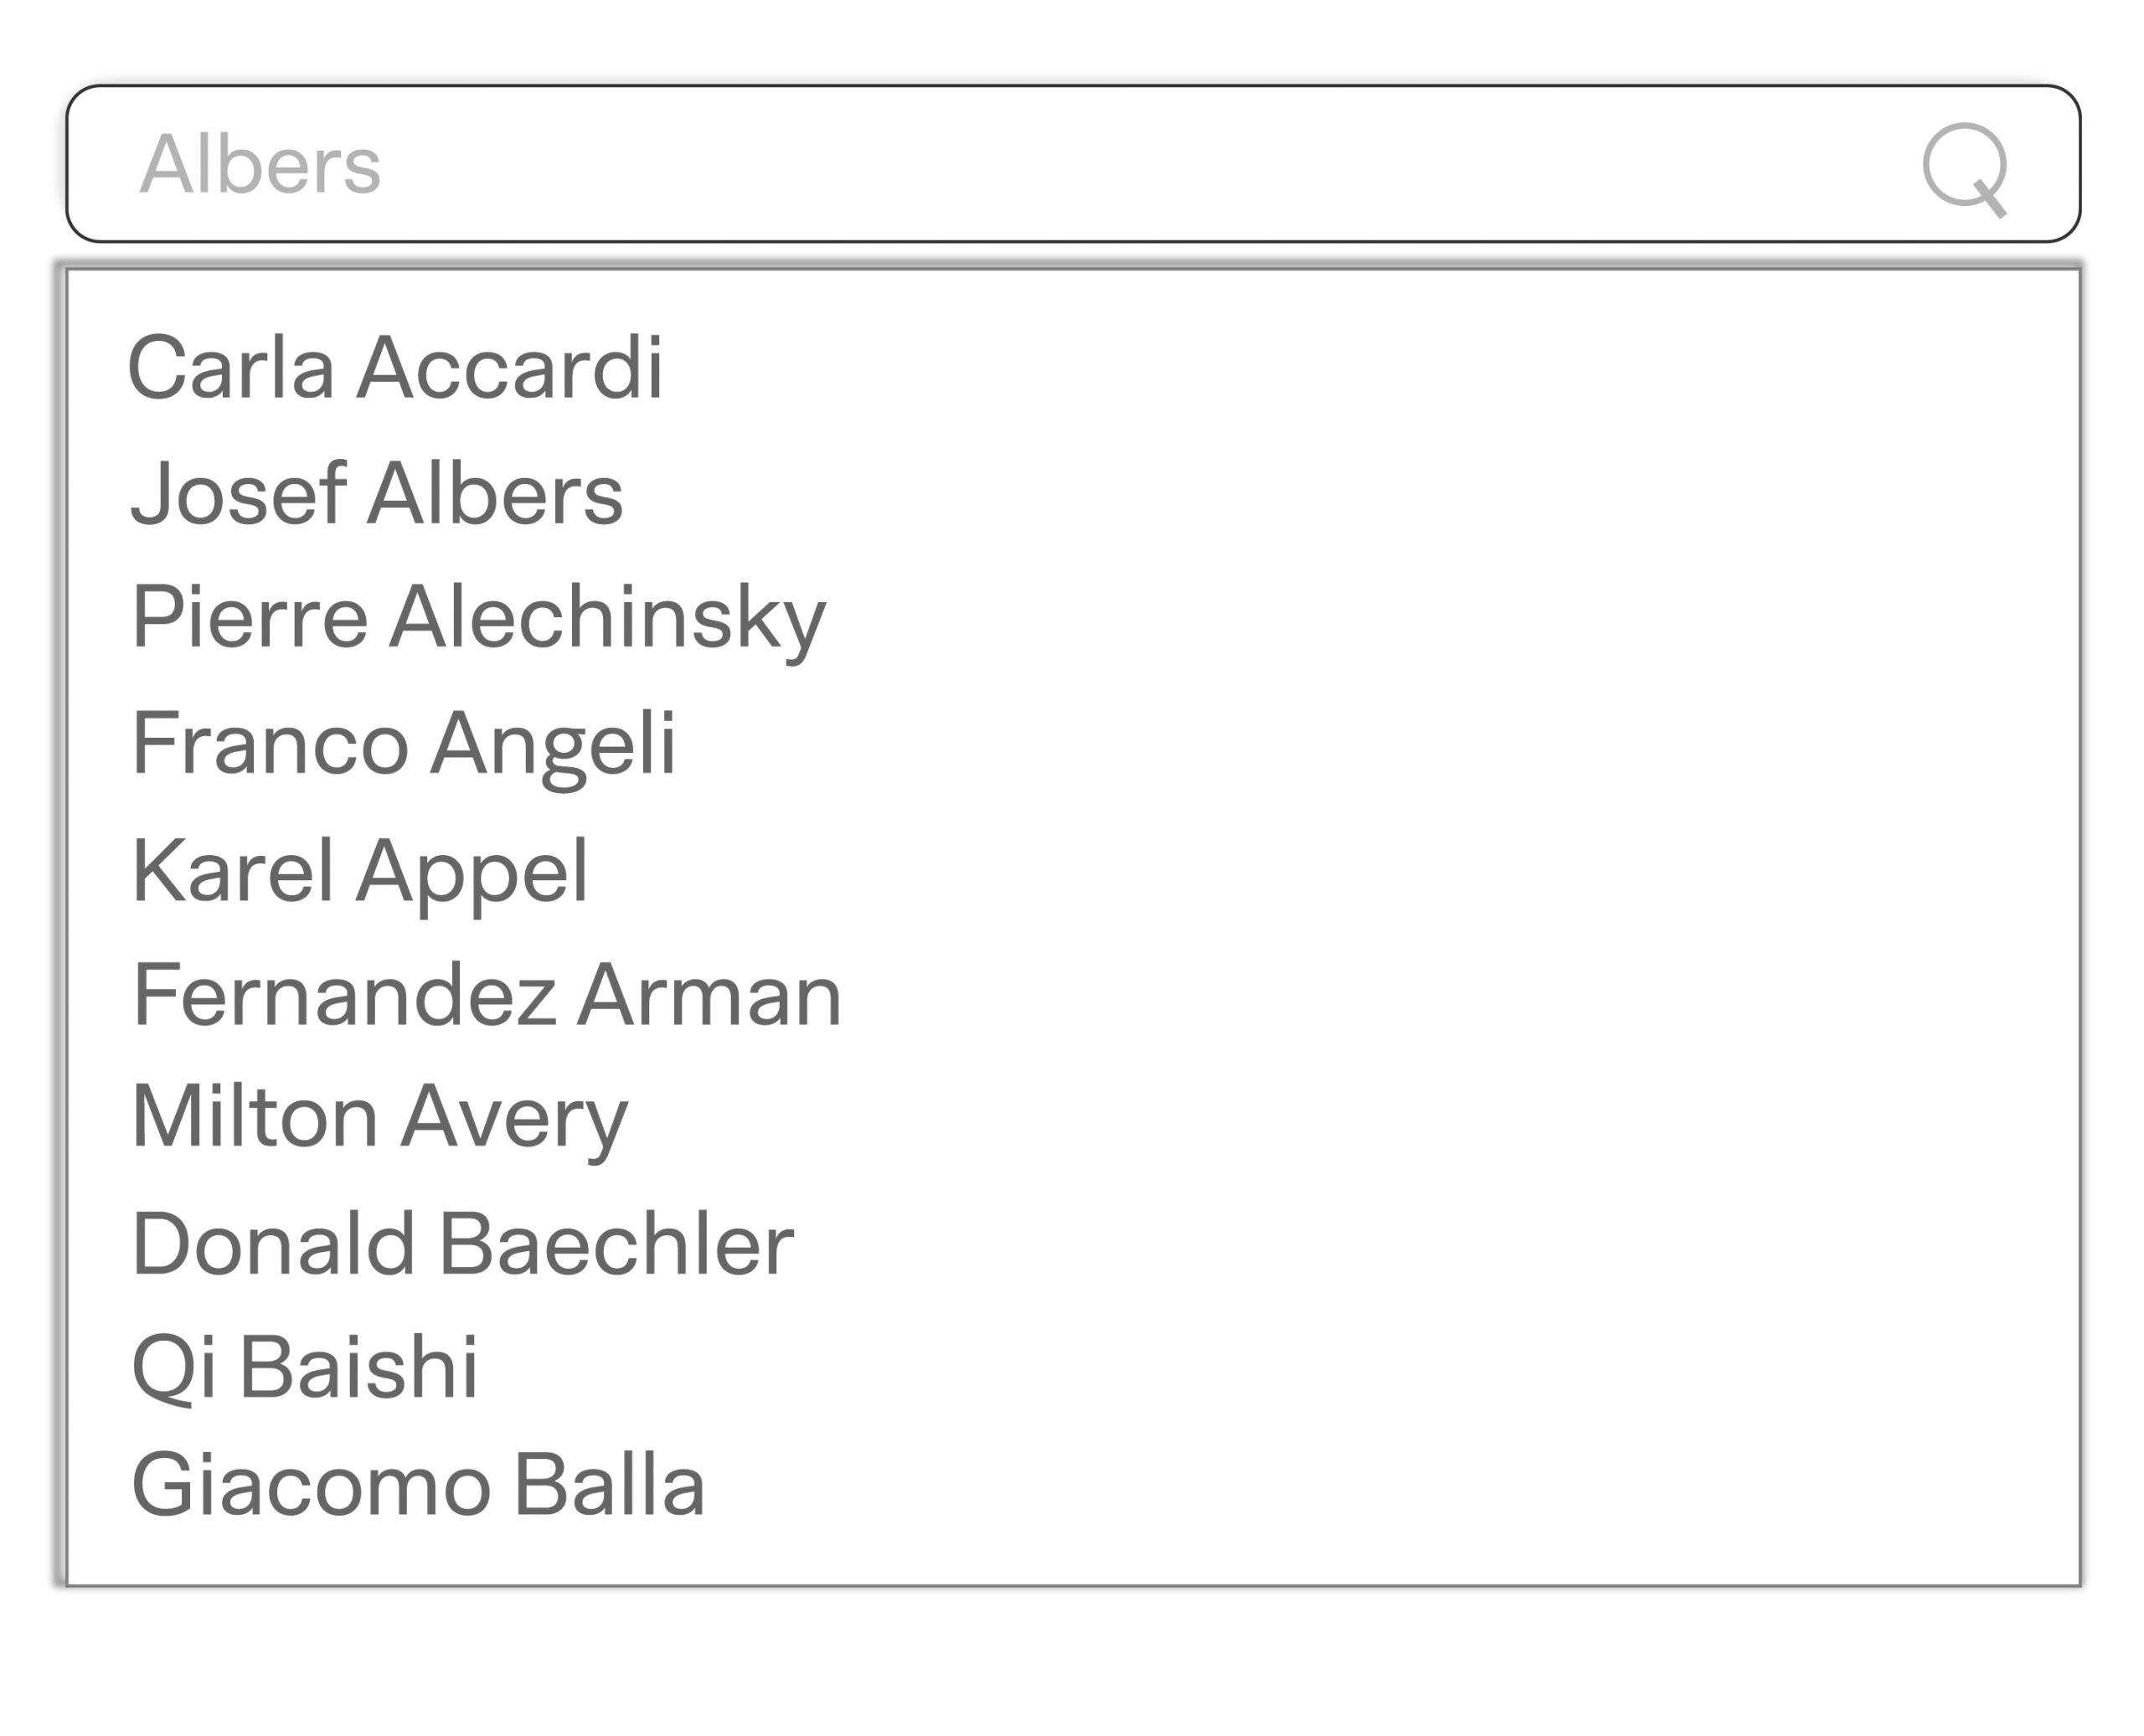
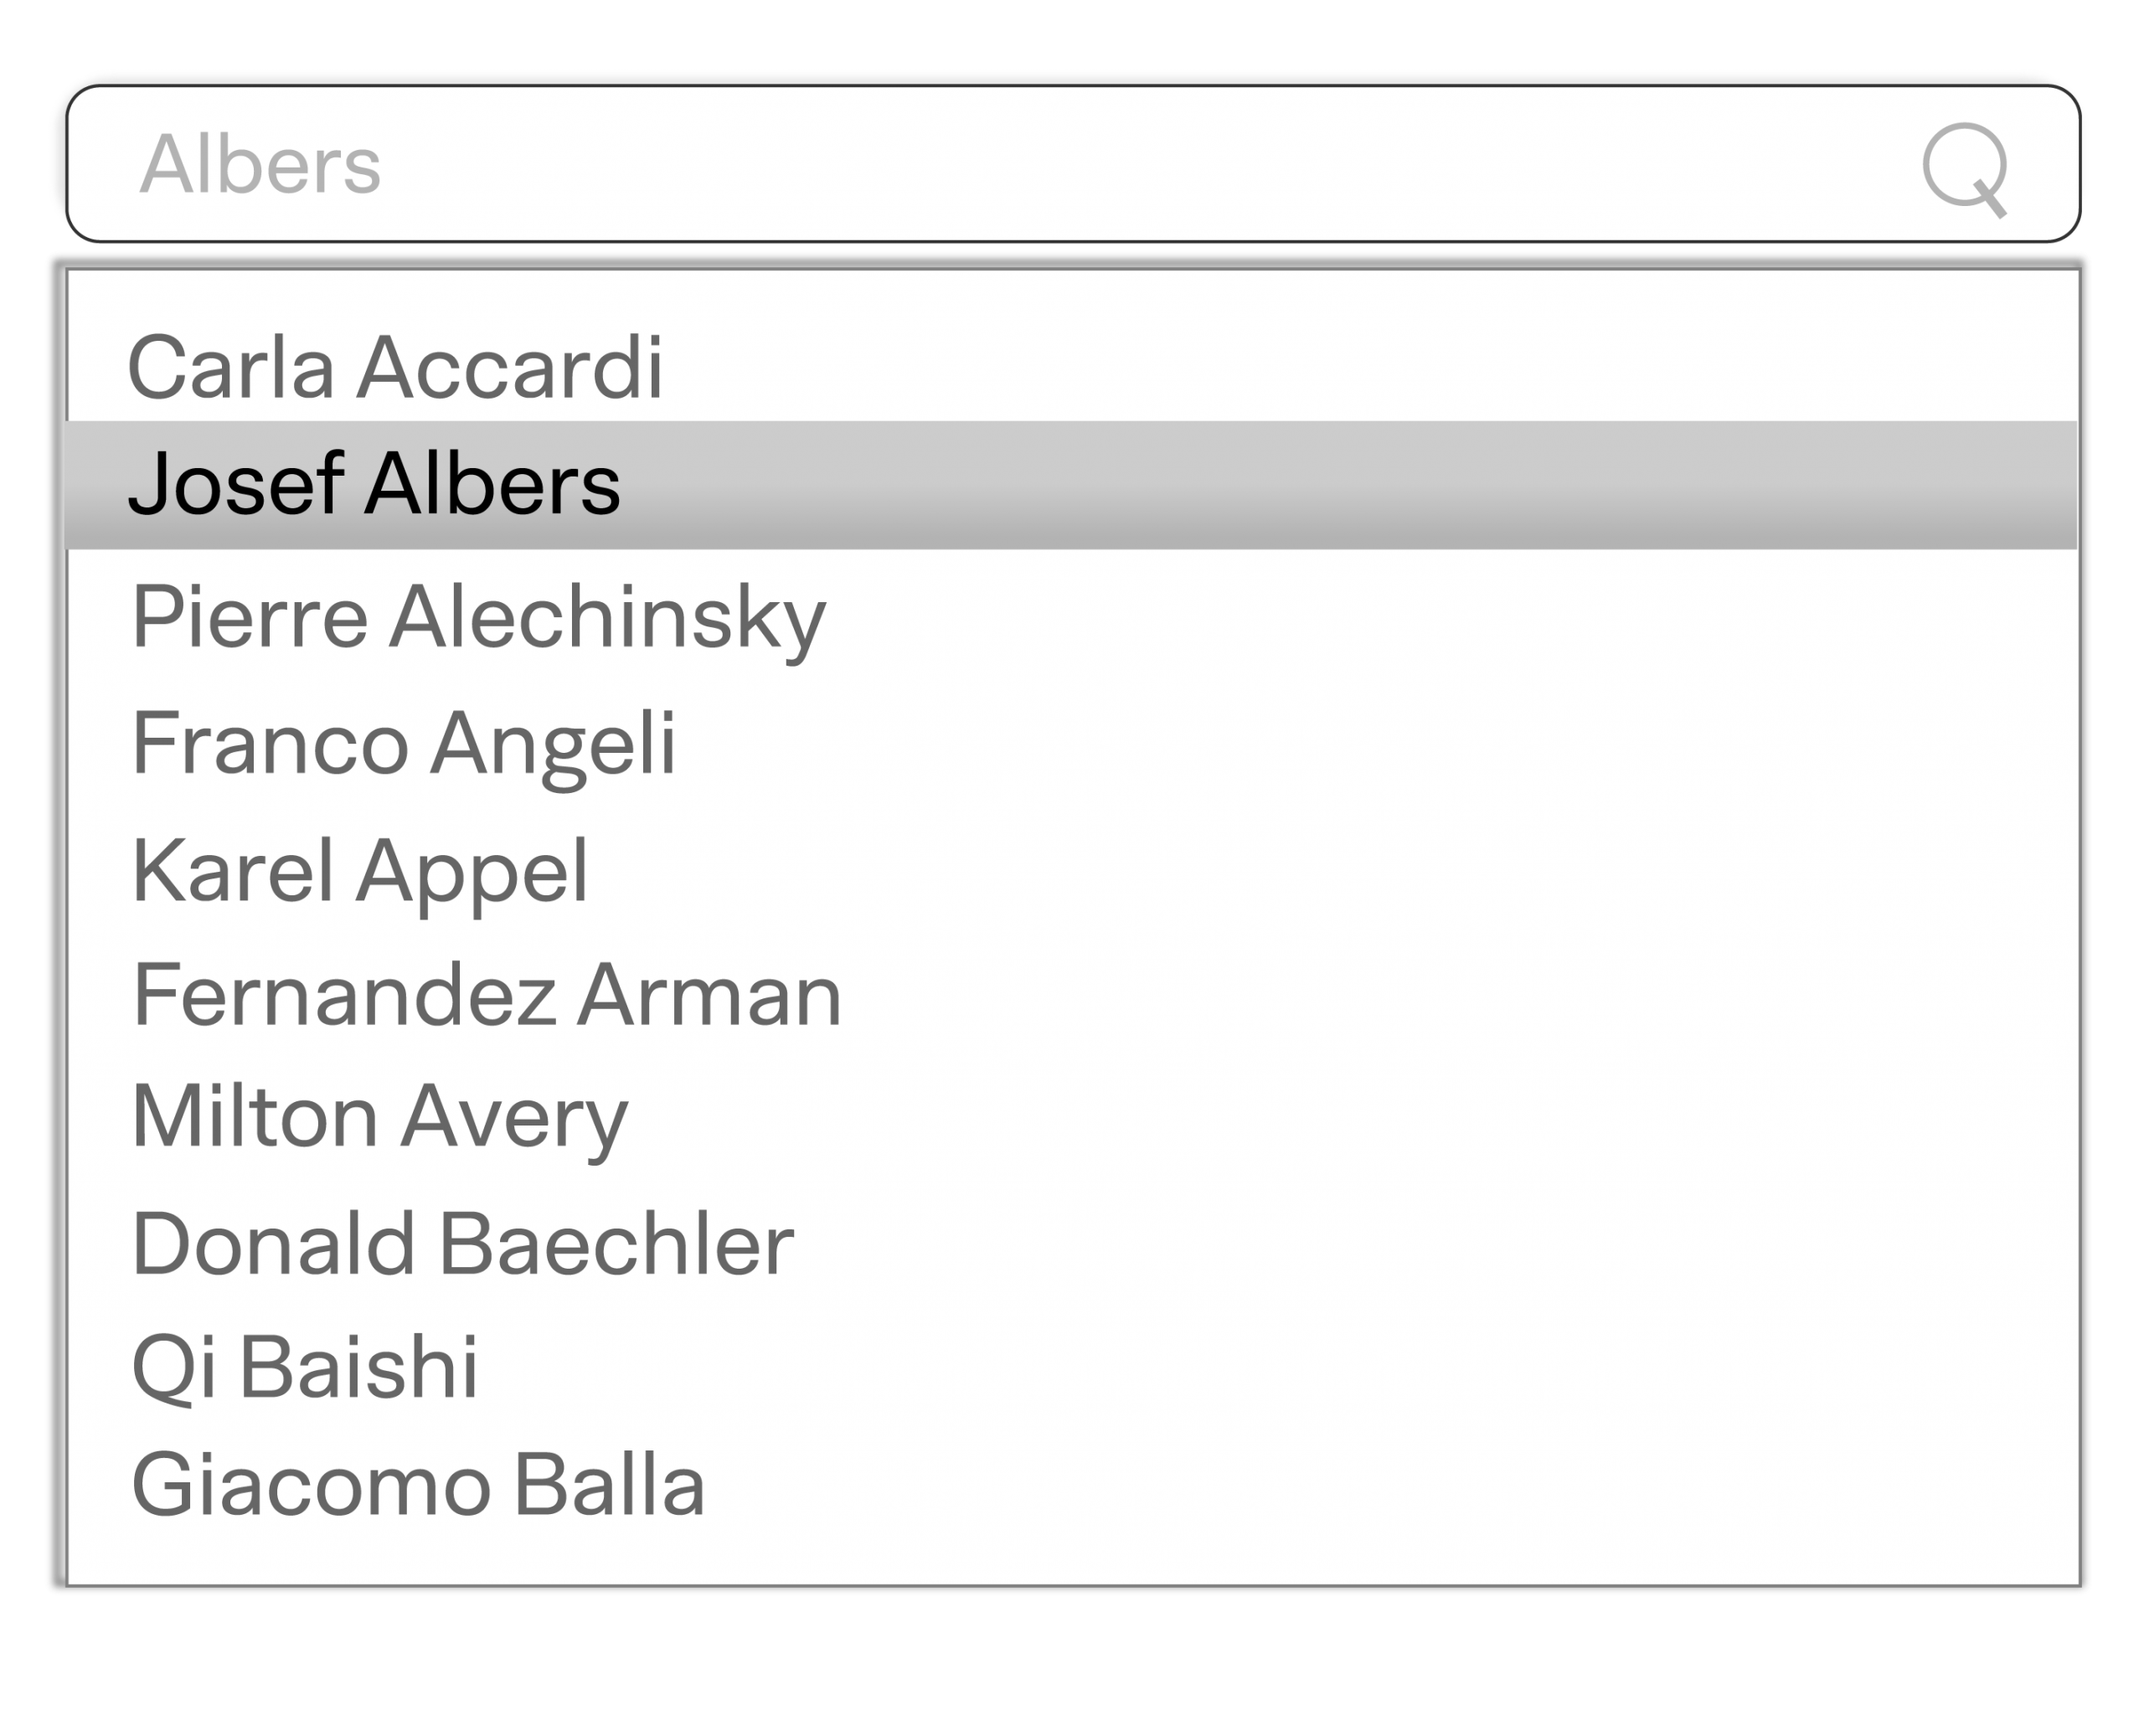
Over 800 Artists Available
Choose from over 800 tracked artists, from established names to emerging markets. Every result is verified back to the hammer price — and we’re continually expanding our coverage.